
| Name: | Cole Bligh |
|---|---|
| Email: | CBligh@Colgate.edu |
| Office: | Virtual |
| Home Institution: | Colgate University |
| Project: | Protecting Vulnerable Communities from Targeted Violence and Mass Casualty Attacks |
About My Project
This project has two phases that focus on the national, regional, and local response to events, specifically looking at the responses within religious communities. Phase 1 is focused on continuing to build out the R.E.S.I.L.I.E.N.C.E. Model that Dr. Ron Clark has been developing for the last year or so. We are coming onto this project at the very end so we are going to be focused on polishing the model to be relased to the public, on or around June 17.
The second phase is focused on understanding the national, regional, and state responses to the coronavirus pandemic and how the responses as well as the timing impacted the severity of the pandemic in each state. Once we have collected this data we are going to be looking at how to better prepare the US for a second wave of coronavirus cases and for future pandemics.
Research Log
Week 1
This week I did some background research on Mass Casualty attacks on vulnerable communities and specifically the Charleston church shooting. The Charleston church shooting is significant because my mentors, Ava Majlesi and Dr. Ron Clark, are planning to roll out the R.E.S.I.L.I.E.N.C.E. Model on June 17, the 5th anniversary of this shooting. In addition to doing background research, Dr. Clark gave us his write up on the RESILIENCE Model for us to read over as well as 30 transcripts to read through and to find any quotes or bits of information that I felt should be included with the RESILIENCE Model.
Week 2
At the beginning of this week we wrapped up our work on the RESILIENCE model and began to work on the COVID-19 aspect of our research project. To start Yuqing, Elisavet, James, and I presented to the REU DIMACS Rutgers community an overview for our research this summer. We also began the week wrapping up our work on the RESILIENCE Model. Over the weekend we identified quotes from the interviews to be considered for adding into the RESILIENCE Model release and we put all of these quotes into a single document that was shared with Dr. Ron Clark. For the second part of the week we began to focus on the second phase of our project, which is understanding and evaluating the COVID-19 response by the US and its territories. To begin this process, we split the states into 4 regions: Northeast, South, Midwest, and West and we began to research the each state's demographics, COVID-19 response, COVID-19 outcomes, and put into a uniform template that we are creating.
Week 3
This week I participated in the TRIPODS Data Science Boot Camp instructed by Professor Matthew Stone of Rutgers University. This was a great experience as Data Science is a field that I am greatly interested in and the topics that we covered in this course will definitely be useful for later in my research project. In addition, I collected data on the Western State's COVID 19 response. This data will be used in analysis in the next phase of the research project to draw conclusions on what actions proved to be the most useful in preventing the spread of COVID 19 and to help guide the response of states in the next wave and in future pandemics.
Week 4
This week my research focused on downloading data for COVID cases and deaths into a spreadsheet to create graphs for each state as well as putting the data I had already collected into a template. In addition, I also began some background research on DHS to begin collecting data on their configuration and COVID response next week. As well as continuing my research for this project, I began to do research on how to automatically refresh and obtain data from a website so I would no continually have to update the COVID graphs that I created.
Week 5
This week I continued my research into the DHS, specifically I gathered information on the background and formation of DHS, how they facilitated the COVID response in the US, and how DHS has been encouraged to reform in the past. To gather most of this information I looked to CRS (the Congressional Research Service), GAO (US Government Accountability Office), and the DHS website to read their reports on DHS. Additionally, I continued to update my spreadhseets of COVID over the weekend I found the public API on GitHub that is used in the John's Hopkins coronavirus tracked so I could pull COVID data from and set up semi-automated data pulls on my spreadsheets.
Week 6
This week I finished up my research on DHS, I went back to the GAO website to look at more articles on previous reform recommendations made by the GAO and how those recommendations were implemented and to what extent. Next, I transitioned my research to look more specifically at FEMA and HHS. Similar to what I did for DHS, I looked for past reform recommendations that was made to FEMA and HHS that I could find on CRS and GAO then I went to FEMA's and HHS's websites to look at what they did in response to COVID and to gain a better understanding on the structure of their respective agencies and departments. In addition to working on the government reform aspect of the project, I was responsible for designing the economic overview portion of our COVID-19 state's data and helped to create the display for the cover page for our COVID Data, which is down below under Samples of My Work.
Week 7
This week I continued to do research on government reform looking specifically at CDC and DOD and focusing on their website's information and their COVID-19 response. In addition to looking at CDC and DOD, I found a Pandemic Response Guide online that I think would be interesting to use as a comparison to see what the federal government did and did not do. On the states side of the project, my group wrapped up the designs for the info graphics and compiled the regional roll up data. Now I have added each state into their own info graphic and produced an info graphic for the West Region. To help visualize the future projections, I learned how to graph an error range on an excel line graph to show the possible future projections of the COVID-19 pandemic. Below in the Samples of My Work section in this webpage I have included a picture of the future projections of COVID-19 in the West region if we stick to the current projection/policies, have mandated easing where we lift socially distancing and do not reinstate mandates as cases go up, and in the scenario where 95% of individuals are wearing masks. The data for these projections came from tye Institue of Health Metrics and Evaluation at the University of Washington.
Week 8
This week I collected data on DOD reform through the CRS and GAO and I coded and analyzed the major themese for reform of DHS. Then the rest of the week was spent on researching and creating the info graphics for the South Region and we began working on our policy paper, where we are making policy recommendations based on the evidence we have found in the government reform and COVID data aspects of the project. Once the info graphics were completed we began building graphs of specific data sets - uninsured, poverty rate, health care professional shortages, medically underserved areas, cases, tests, deaths, hospitalizations, ICU Headroom used, number of peaks, days between first case and first peak, R0, and contact tracting - to allow for people when we present our findings to visually see correlations between certain aspects to the prevalence and fatality rates.
Week 9
This week was focused on creating a Policy Paper and a final Presentation based on the data that we had found throughout the summer and present the conclusions we drew from the data. In the Policy Paper we outlined 3 policy recommendations TTT (Testing, Tracking, Treating), DIM (Distance, Isolate, Mask), and POLICY (Prepare & Organize, Lead & Inform, and Create & Yaager results). These evidence based policy recommendations if implemented effectively would allow for a coordinated and timely response to a pandemic like the COVID-19 pandemic we are currently fighting against. In addition, I wrapped up the DHS reform breaking the reform recommendations into 5 categories - Congressional, Data & Research, Preparedness, Communication, and Operations & Management. Going forward, all of us - Elisavet, James, Yuqing, and I - are all planning to continue to work with Dr. Clark and the Miller Center for the rest of the summer and I am looking forward to digging deeper into the data to explore how COVID has disproportionately affected minorities, how government policies affected each state's trajectories, and the role of age and race distribution in a state's cases.
Samples of My Work
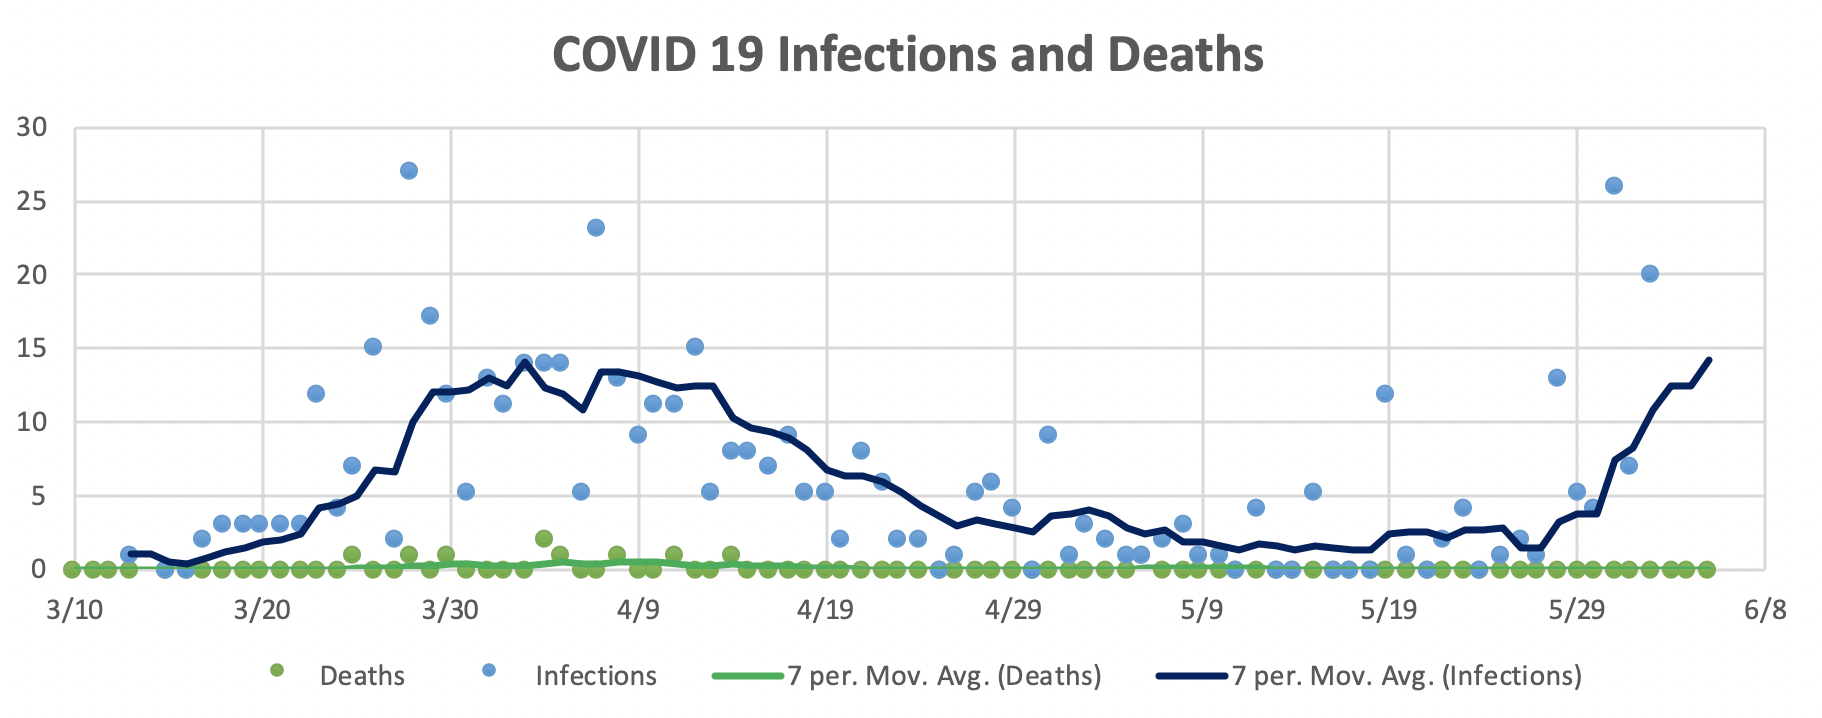
Graph of COVID-19 Infections and Deaths in Alaska
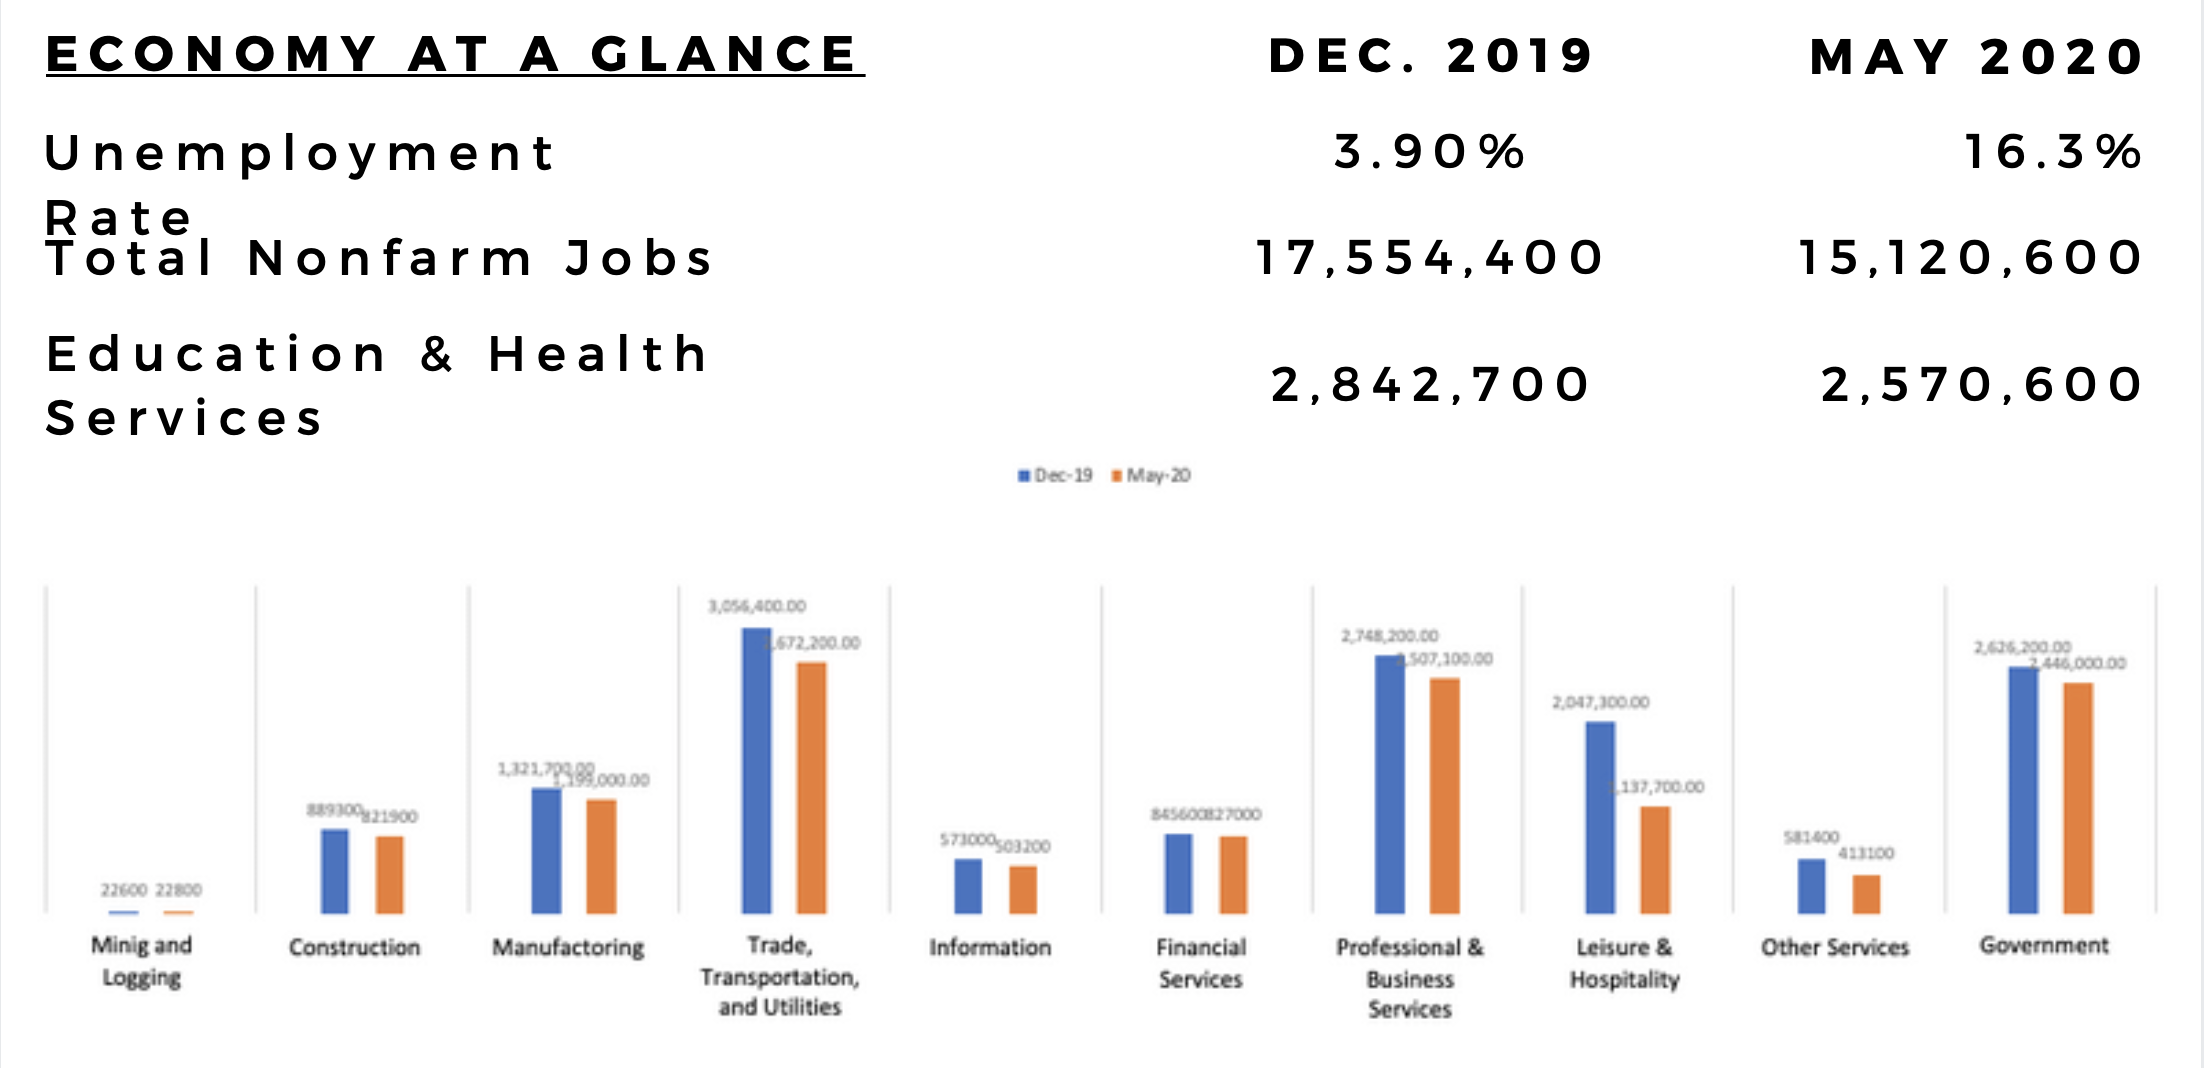
Visual Display of California's Workforce in December 2019 vs. May 2020
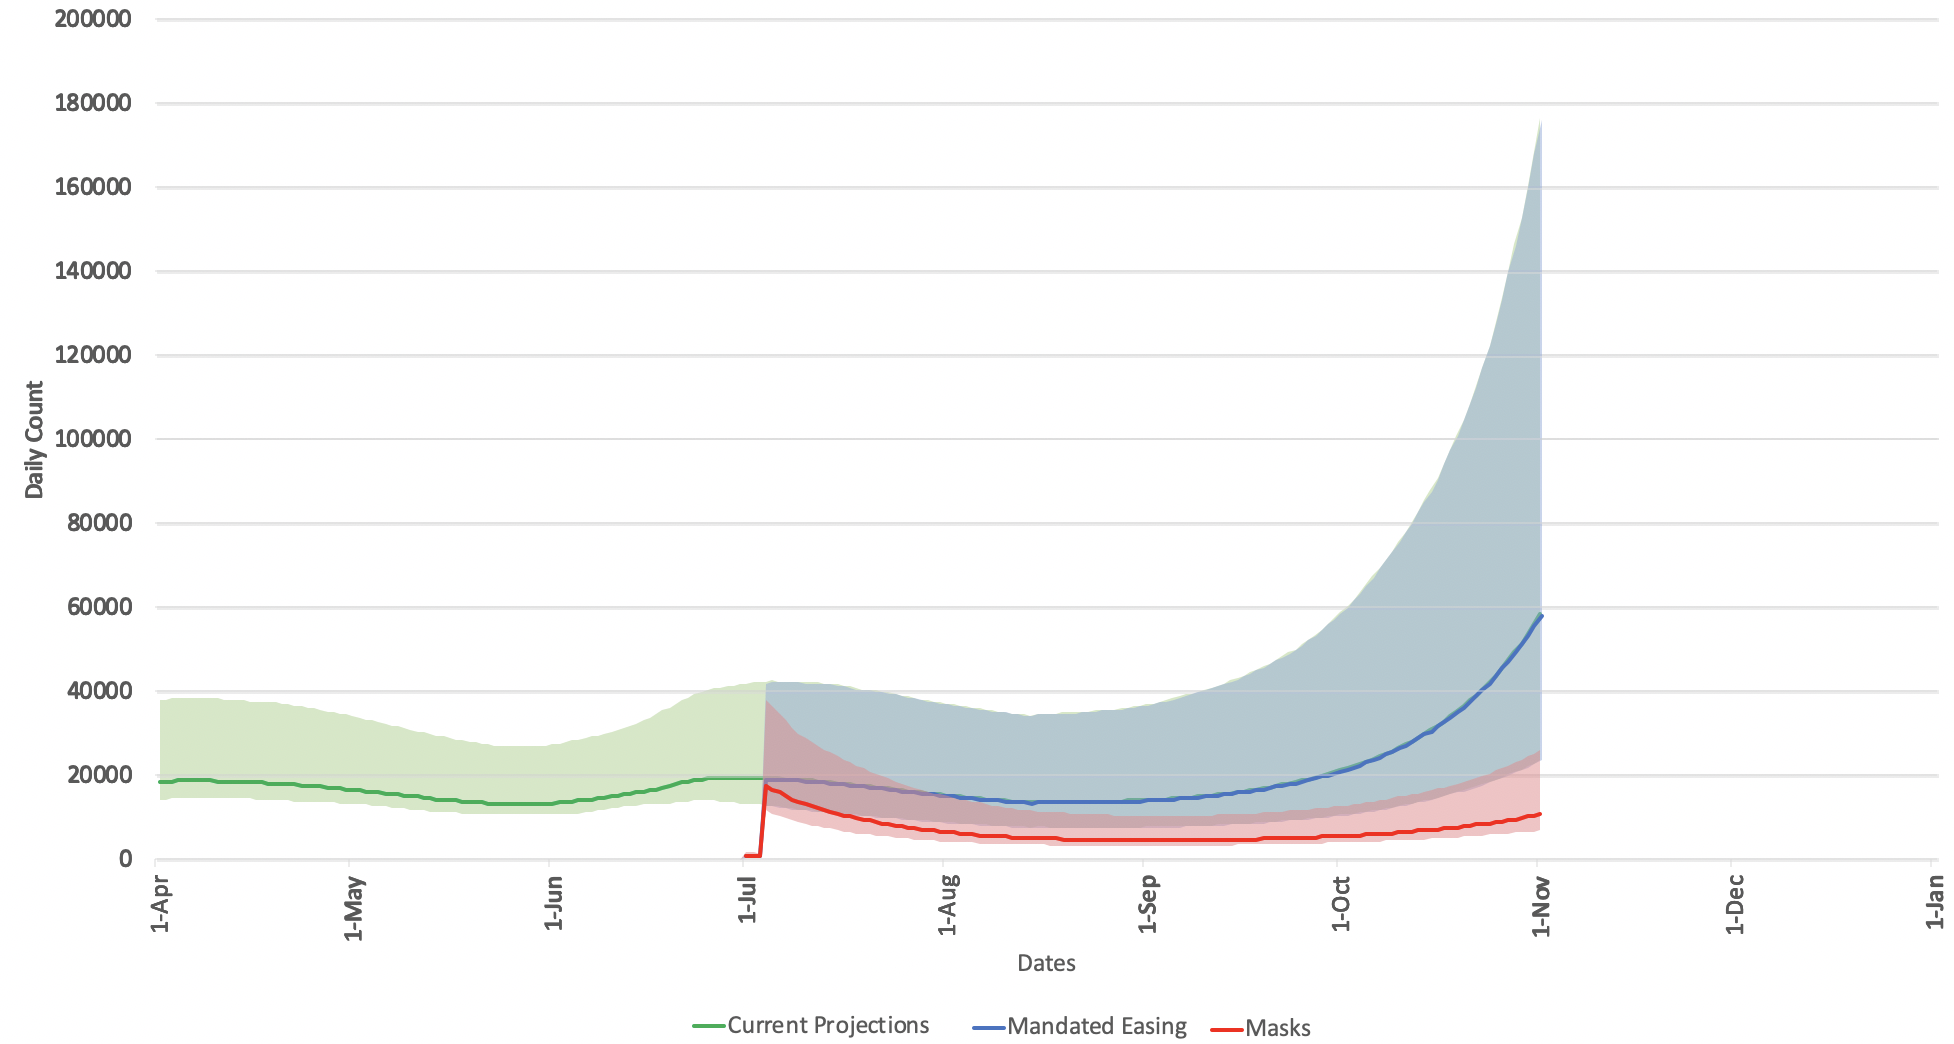
Future Projections of West Region's COVID-19 cases